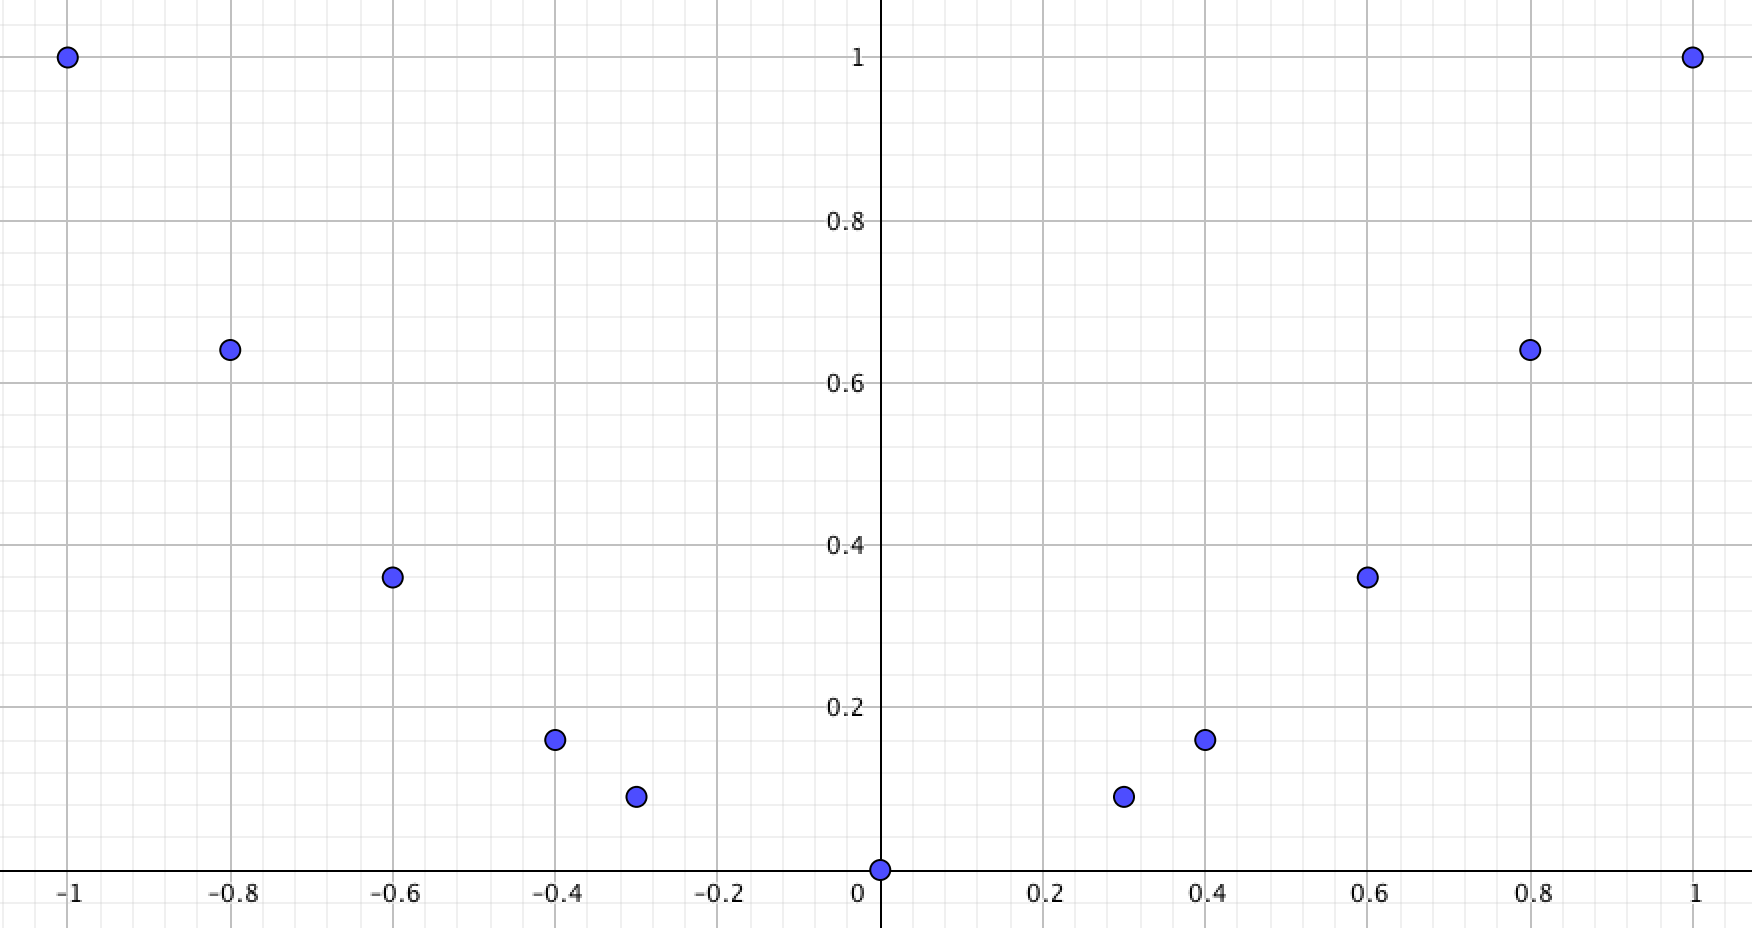
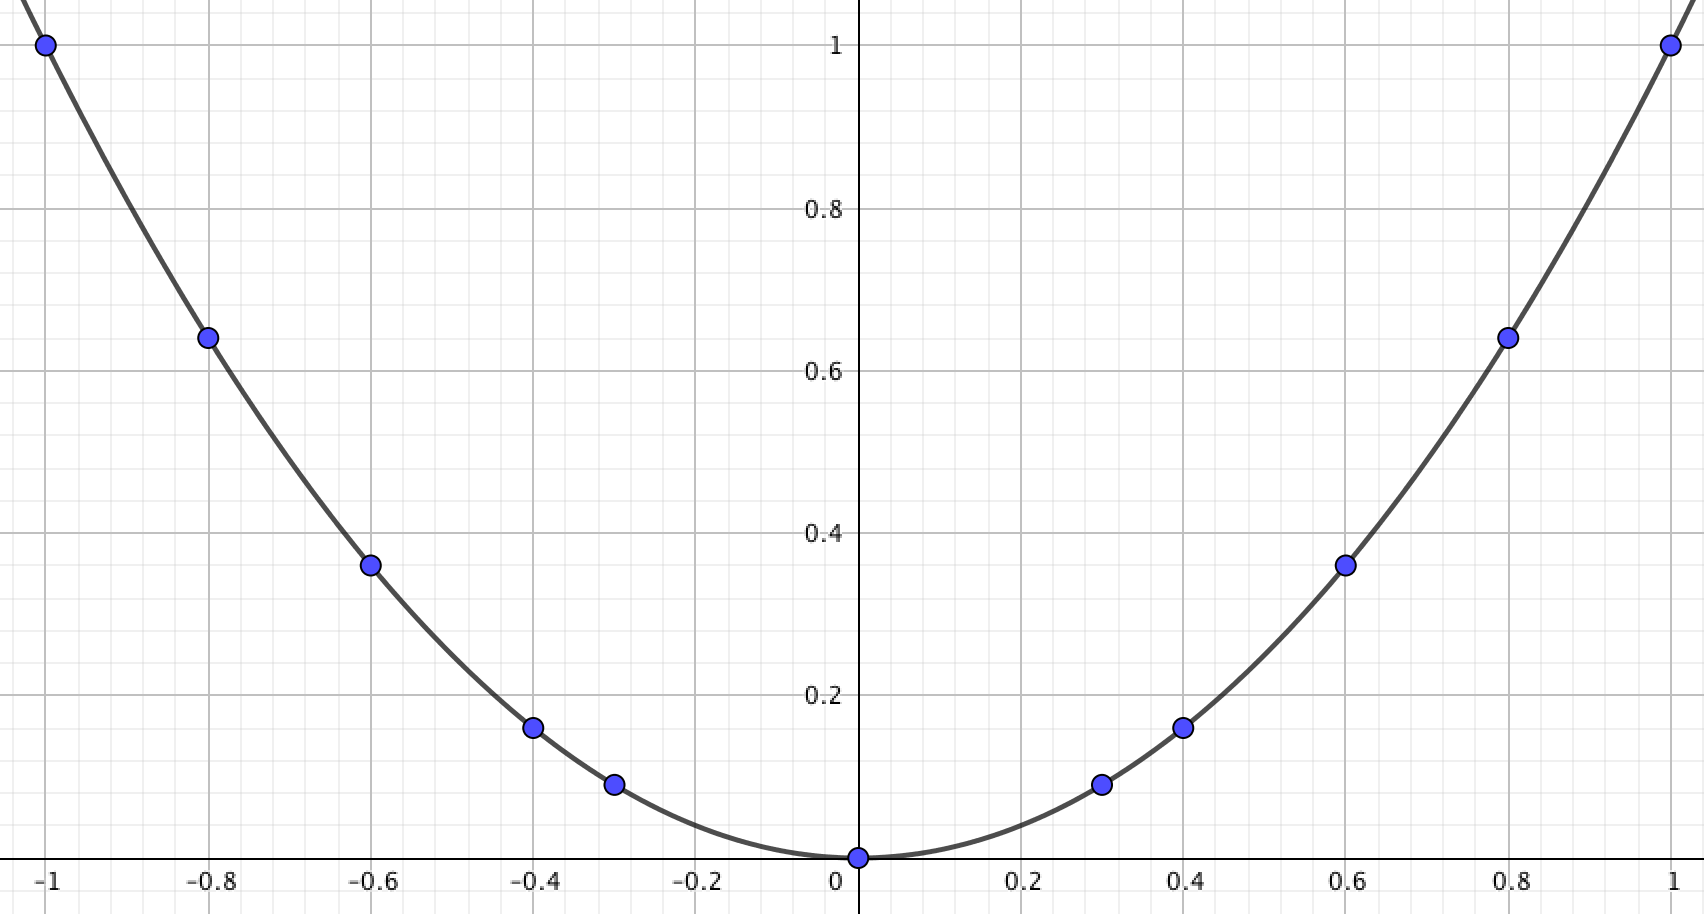
\(\displaystyle [-1;\, 1] \small \) кесіндісінде \(\displaystyle y=x^2\) квадраттық функциясының графигін салу.
\(\displaystyle \small y=x^2{\small }\) квадраттық функциясы мәндерінің кестесін толтырайық:
| \(\displaystyle \small x\) | \(\displaystyle \small -1\) | \(\displaystyle \small -0{,}8\) | \(\displaystyle \small -0{,}6\) | \(\displaystyle \small -0{,}4\) | \(\displaystyle \small -0{,}3\) | \(\displaystyle \small 0\) | \(\displaystyle \small 0{,}3\) | \(\displaystyle \small 0{,}4\) | \(\displaystyle \small 0{,}6\) | \(\displaystyle \small 0{,}8\) | \(\displaystyle \small 1\) |
| \(\displaystyle \small y=x^2\) | \(\displaystyle \small \small (-1)^2\) | \(\displaystyle \small (-0{,}8)^2\) | \(\displaystyle \small (-0{,}6)^2\) | \(\displaystyle \small (-0{,}4)^2\) | \(\displaystyle \small (-0{,}3)^2\) | \(\displaystyle \small 0\) | \(\displaystyle \small 0{,}3^2\) | \(\displaystyle \small 0{,}4^2\) | \(\displaystyle \small 0{,}6^2\) | \(\displaystyle \small 0{,}8^2\) | \(\displaystyle \small 1^2\) |
Мәндерді есептейміз:
| \(\displaystyle \small x\) | \(\displaystyle \small -1\) | \(\displaystyle \small -0{,}8\) | \(\displaystyle \small -0{,}6\) | \(\displaystyle \small -0{,}4\) | \(\displaystyle \small -0{,}3\) | \(\displaystyle \small 0\) | \(\displaystyle \small 0{,}3\) | \(\displaystyle \small 0{,}4\) | \(\displaystyle \small 0{,}6\) | \(\displaystyle \small 0{,}8\) | \(\displaystyle \small 1\) |
| \(\displaystyle \small y=x^2\) | \(\displaystyle \small 1\) | \(\displaystyle \small 0{,}64\) | \(\displaystyle \small 0{,}36\) | \(\displaystyle \small 0{,}16\) | \(\displaystyle \small 0{,}09\) | \(\displaystyle \small 0\) | \(\displaystyle \small 0{,}09\) | \(\displaystyle \small 0{,}16\) | \(\displaystyle \small 0{,}36\) | \(\displaystyle \small 0{,}64\) | \(\displaystyle \small 1\) |
Жазықтықта нүктелерді салайық:

\(\displaystyle \small y=x^2\) квадраттық функциясының графигін қажет болған жағдайда тағы да нүктелер қосып, алынған нүктелер бойынша салайық:

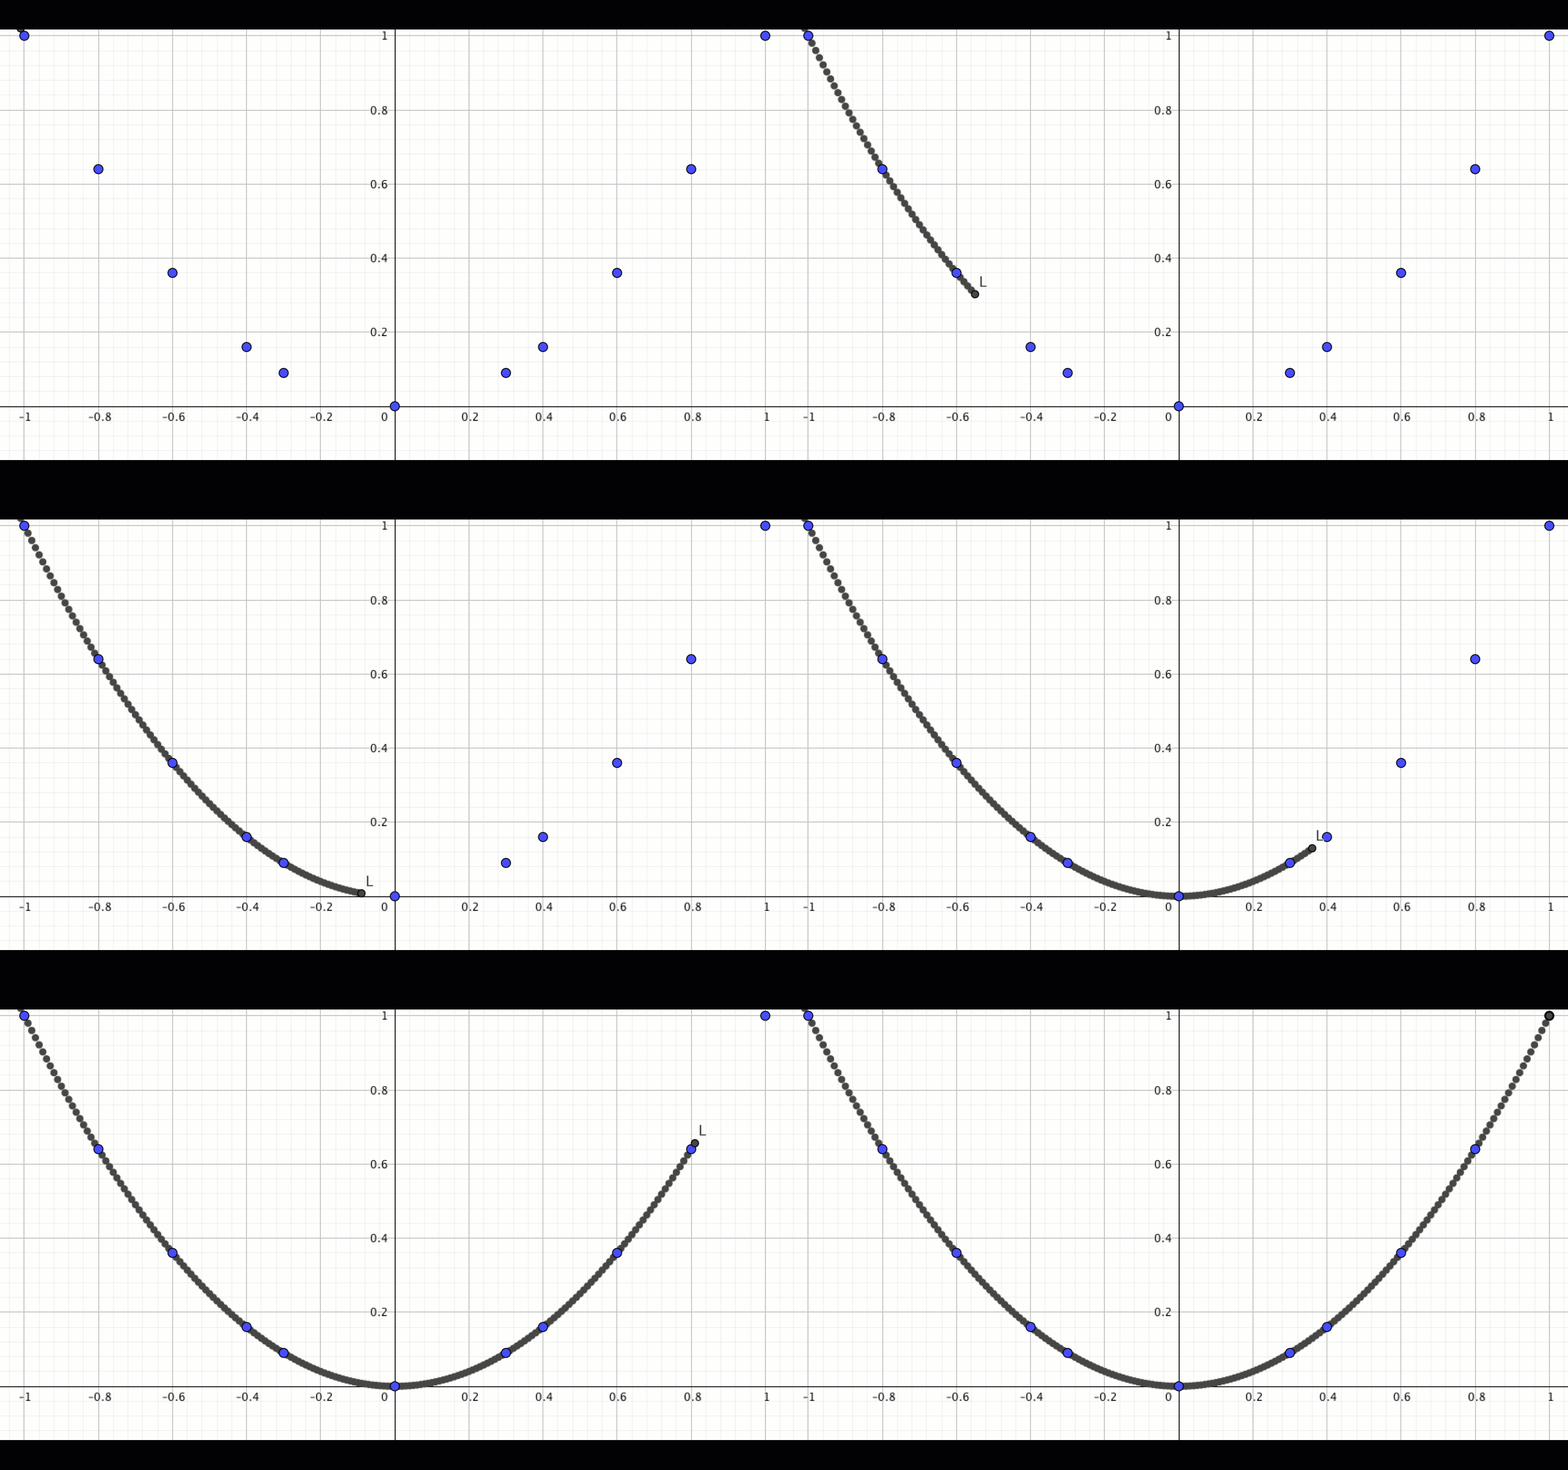
Нүктелер бойынша салу
Егер \(\displaystyle \small -1 \)-ден \(\displaystyle \small 1{\small } \) дейінгі координаттары бар OX осі бойымен көптеген нүктелер салсақ, онда біз графиктің келесі суретін аламыз:
