\(\displaystyle y=\frac{1}{x}{\small }\) функциясының мәндер кестесін толтырыңыз :
| \(\displaystyle \small x\) | \(\displaystyle \small -2\) | \(\displaystyle \small -1{,}25\) | \(\displaystyle \small -1\) | \(\displaystyle \small -0{,}8\) | \(\displaystyle \small -0{,}5\) | \(\displaystyle \small -0{,}4\) |
| \(\displaystyle \small y=\frac{1}{x}\) |
| \(\displaystyle \small x\) | \(\displaystyle \small 0{,}4\) | \(\displaystyle \small 0{,}5\) | \(\displaystyle \small 0{,}8\) | \(\displaystyle \small 1\) | \(\displaystyle \small 1{,}25\) | \(\displaystyle \small 2\) |
| \(\displaystyle \small y=\frac{1}{x}\) |
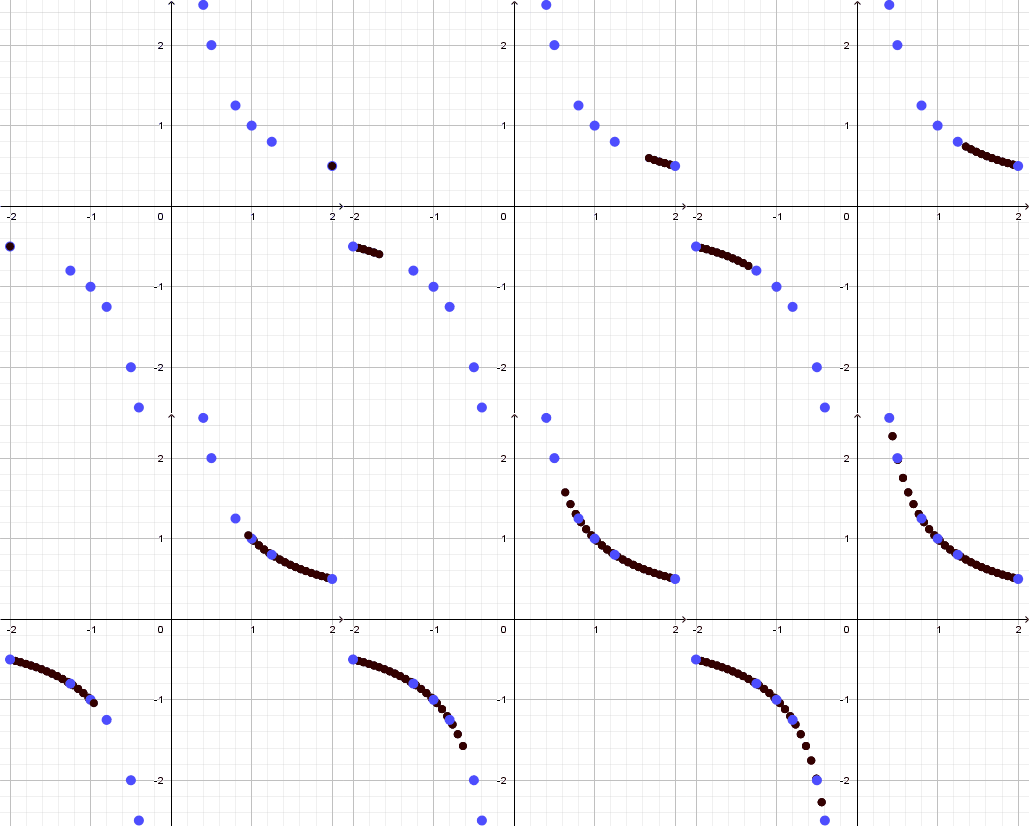
Алынған нүктелер бойынша гиперболаны ойша құрыңыз:
\(\displaystyle y=\frac{1}{x}{\small }\) функциясының мәндер кестесін толтырыңыз :
| \(\displaystyle \small x\) | \(\displaystyle \small -2\) | \(\displaystyle \small -1{,}25\) | \(\displaystyle \small -1\) | \(\displaystyle \small -0{,}8\) | \(\displaystyle \small -0{,}5\) | \(\displaystyle \small -0{,}4\) |
| \(\displaystyle \small y=\frac{1}{x}\) | \(\displaystyle \small \frac{1}{-2}\) | \(\displaystyle \small \frac{1}{-1{,}25}\) | \(\displaystyle \small \frac{1}{-1}\) | \(\displaystyle \small \frac{1}{-0{,}8}\) | \(\displaystyle \small \frac{1}{-0{,}5}\) | \(\displaystyle \small \frac{1}{-0{,}4}\) |
| \(\displaystyle \small x\) | \(\displaystyle \small 0{,}4\) | \(\displaystyle \small 0{,}5\) | \(\displaystyle \small 0{,}8\) | \(\displaystyle \small 1\) | \(\displaystyle \small 1{,}25\) | \(\displaystyle \small 2\) |
| \(\displaystyle \small y=\frac{1}{x}\) | \(\displaystyle \small \frac{1}{0{,}4}\) | \(\displaystyle \small \frac{1}{0{,}5}\) | \(\displaystyle \small \frac{1}{0{,}8}\) | \(\displaystyle \small \frac{1}{1}\) | \(\displaystyle \small \frac{1}{1{,}25}\) | \(\displaystyle \small \frac{1}{2}\) |
Мәнін есептейміз:
| \(\displaystyle \small x\) | \(\displaystyle \small -2\) | \(\displaystyle \small -1{,}25\) | \(\displaystyle \small -1\) | \(\displaystyle \small -0{,}8\) | \(\displaystyle \small -0{,}5\) | \(\displaystyle \small -0{,}4\) |
| \(\displaystyle \small y=\frac{1}{x}\) | \(\displaystyle \small -0{,}5\) | \(\displaystyle \small -0{,}8\) | \(\displaystyle \small -1\) | \(\displaystyle \small -1{,}25\) | \(\displaystyle \small -2\) | \(\displaystyle \small -2{,}5\) |
| \(\displaystyle \small x\) | \(\displaystyle \small 0{,}4\) | \(\displaystyle \small 0{,}5\) | \(\displaystyle \small 0{,}8\) | \(\displaystyle \small 1\) | \(\displaystyle \small 1{,}25\) | \(\displaystyle \small 2\) |
| \(\displaystyle \small y=\frac{1}{x}\) | \(\displaystyle \small 2{,}5\) | \(\displaystyle \small 2\) | \(\displaystyle \small 1{,}25\) | \(\displaystyle \small 1\) | \(\displaystyle \small 0{,}8\) | \(\displaystyle \small 0{,}5\) |
Жазықтықта нүктелер құрайық:
Алынған нүктелер бойынша \(\displaystyle y=\frac{1}{x}\) (гипербола) функциясын графикке салыңыз, қажет болған жағдайда көбірек нүктелер қосыңыз:
Нүкте бойынша құру
Егер \(\displaystyle ОХ\) ось бойынша \(\displaystyle -2 \) - ден \(\displaystyle 2{\small , } \) -ге дейінгі координаттары бар көптеген нүктелер салсақ, онда біз графиктің келесі суретін аламыз:
